The Aged Care Wait List is a Formula

The first Wait Times Report under the Aged Care Act 2024 was published on 12 May 2026. A headline of 347 days for Support at Home and 167 days for residential care has attracted attention. What has attracted less attention is what is driving those figures, and what they mean for your business model.
Two Home Care queues
Before reading the data, it helps to understand that there are two distinct queue measurements at play, and they are not the same thing.
| Elapsed Time Queue | Formal Wait Time Queue | |
|---|---|---|
| What it is | The publicly reported figure — total time from application to commencement, including all pre-queue stages | The queue defined under the Act — time from access approval (Stage 4) to place allocation |
| Where it appears | The Department's Wait Times Report; the 347-day median headline | Sections 93-10 to 93-14 of the Aged Care Rules 2025; the November 2027 target |
| What's included | Registration, triage, assessment, allocation queue, commencement window | Allocation queue only from assessment to commencement of funding |
| November 2027 target | Does not apply to this measure | Weighted average must fall to ≤3 months by 1 November 2027 (s 93-14) |
The practical consequence: 48,592 people awaiting triage at end of March 2026, and an estimated 15,000 awaiting comprehensive assessment, are invisible to the statutory target. A fall in the Formal Wait Time Queue does not necessarily mean faster service delivery overall.
The number is not what it looks like
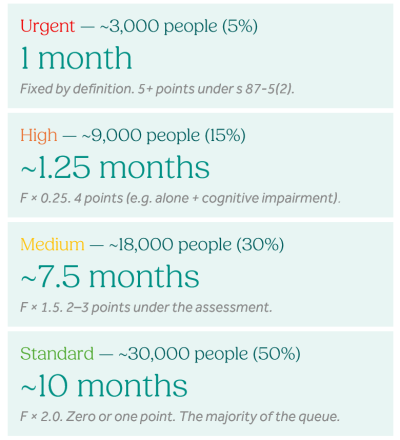
The 347-day Support at Home median in the Elapsed Time Queue is not an administrative backlog. The Formal Wait Time Queue that sits within it is the deliberate, mathematical output of a priority queue algorithm set out in sections 93-10 to 93-14 of the Aged Care Rules 2025. Every category wait time — Urgent, High, Medium, Standard — is derived from a single formula. If you change the formula's inputs, the wait times shift mechanically.
Industry hopes that the extended wait times for packages that we have had in the lead-up to the new Aged Care Act will gradually improve through increased package releases and better process management are misplaced. The Formal Wait Time Queue requires the System Governor to maintain average wait times for each class of package that get longer when more people are in the queue. The first time there will be a requirement to reduce the average based factors other than queue length is after 1 November 2027, when the legislation imposes a three months weighted average target.
The seven stages before services begin
Every applicant moves through a defined statutory pipeline. The wait-time clock that feeds the section 93-14 weighted average only starts at Stage 4 — access approval. Everything before that point is invisible to the statutory target.
1 Registration My Aged Care | 2 Triage 28-day max (s 57-5) | 3 Assessment IAT applied | 4 Access approval CLOCK STARTS — s 5-5 | 5 Priority category U / H / M / S | 6 Allocation Algorithm ss 93-10 to 93-14 | 7 Commencement 56 days (84 ext.) |
What the formula actually produces
The queue is managed through a wait time factor (F) that the Department calculates daily. F is derived from the overall system target (T) and the mix of applicants across the four priority categories. Every category threshold flows mechanically from F.
Funding sets the ceiling on what the algorithm can do
The number of places available for allocation under section 91 of the Act is determined by Commonwealth funding — Treasury and Cabinet, through the Budget. This is the binding constraint. No matter how the algorithm is configured, it cannot allocate places that have not been funded.
The Government has planned a release of approximately 83,000 packages in FY2025–26. Under the Act, this number is set by the Minister in advance of package release, including the proportion of fully funded and interim (60% of funding) packages. The Rules then set a fixed formula and allocation method for the System Governor to distribute these packages to participants. This creates a direct tension with the November 2027 target: if the target is to be met primarily through additional places, those places must be funded. If they are not fully funded, the levers below can make the target easier to reach on paper, — but they do not add capacity or reduce wait times for those in the queue.
Illustrative queue composition at F ≈ 5 — proportions are modelled, not published data. The Department does not publish queue composition by priority category.
The November 2027 target — read it carefully
Section 93-14(b)(ii) requires the weighted average current wait time to fall to no more than three months by 1 November 2027. It is a ceiling on a calculation — not a service promise. It applies only to individuals who have been assigned a priority category. The 48,592 individuals awaiting triage, and the estimated 15,000 awaiting comprehensive assessment, do not contribute to that average at all.
Meeting the target will almost certainly require additional funding — the gap between the current median and the three-month ceiling is too large to close through queue mechanics alone. But the mechanics matter because they determine how much new funding is needed, and how transparently that need is reported. Several levers are available to the System Governor that can reduce the measured wait time independently of place releases, making the target easier to reach on paper. At least two appear to already be in operation:
(Click to expand)
What this means for Support at Home providers
The operating reality in four points
(Click to expand)
Residential care — a different system, a hidden tail
The Wait Times Report covers both Support at Home and residential care. On the headline median, residential care looks faster: 167 days against 347 days for Support at Home. That comparison masks important differences in the queues.
The mean–median gap tells an interesting story. Support at Home has a gap of just 17 days — a tight, orderly queue where the algorithm keeps almost everyone close to the same threshold. Residential care has a gap of 229 days, or 137% of the median. That is the signature of a heavily skewed distribution with a very long tail. The charts below, derived from log-normal fits to the published data, show the difference clearly.
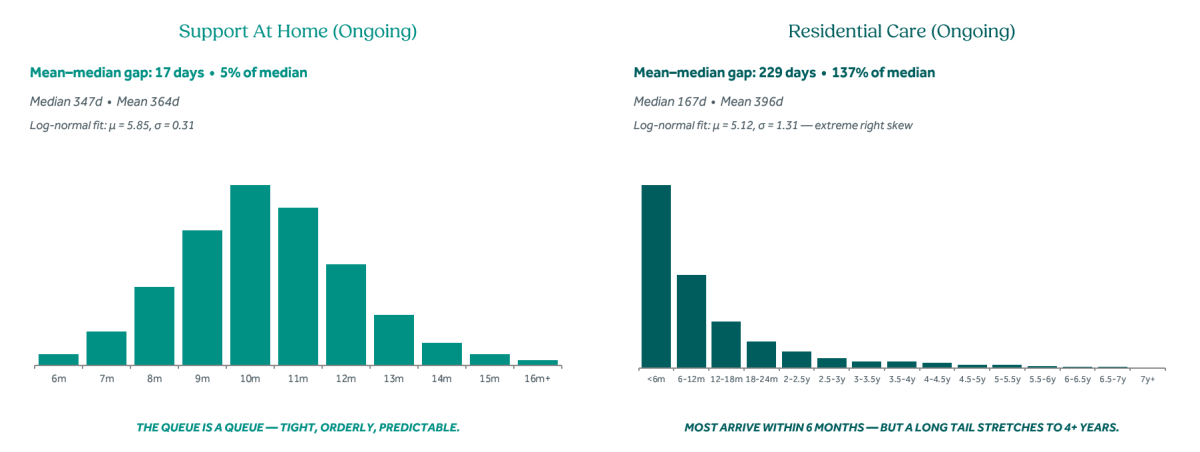
Source: Pride Aged Living Distribution Analysis, May 2026; Wait Times Report 12 May 2026, Tables 3 & 4. Charts based on log-normal fits to published medians and means — estimates only.
There is no algorithmic queue for residential care. Allocation depends on bed availability at registered homes. Applicants retain choice of provider, location, and timing. A combination of residents exercising that choice and fluctuations in availability of beds at preferred facilities is what creates the tail. Applying a log-normal fit to the published figures, we estimate the following population behind the residential average:
| Percentile | Wait threshold | Est. people | Interpretation |
|---|---|---|---|
| 0–50th | Under 167 days | ~16,000 | Typical — at or below the median |
| 50–75th | 167–404 days (6–13 months) | ~8,000 | Moderate waits within the published average |
| 75–90th | 404–900 days (13 months – 2.5 years) | ~4,800 | Upper tail — waits beyond the average |
| 90–95th | 900–1,450 days (2.5–4 years) | ~1,600 | Deep tail |
| 95th+ | Over 1,450 days (>4 years) | ~1,600 | Extreme tail |
The structural point for residential providers: the 'queue' is not algorithmic. Geography, accommodation contribution, family proximity, and provider offer all sit with the applicant. Half of all residential admissions arrive within six months of assessment.
The transparency gap
The Department's first Wait Times Report does not publish queue composition by priority category. Without that data, the wait time factor F cannot be calculated directly from public information — only estimated by back-calculation. Industry, providers, and parliamentary scrutiny cannot independently verify whether the November 2027 target is being met through new funding or through queue reshaping.
Future reports should include quarterly U/H/M/S counts, the current determination of T, the resulting F and category thresholds, and the weighted average current wait time as defined in section 93-14(b)(i). All four are calculated internally by the Department already. Publishing them is important for accountability, and the sector should press for this information collectively.
About this analysis: This insight is drawn from Pride Aged Living's Paper on Aged Care Wait Lists (May 2026), which reads the first Wait Times Report (Department of Health, Disability and Ageing, 12 May 2026) against the Aged Care Act 2024 and the Aged Care Rules 2025 (F2025L01173, Compilation No. 5). Queue composition proportions are modelled estimates derived by back-calculation from published medians — the Department does not publish queue composition data. The treatment of 60% interim-funded packages within the s 93-14 weighted average calculation is a matter of ongoing inquiry. Commercial in confidence.
Sources: Aged Care Rules 2025 ss 5-5, 57-5, 87-5, 92A-5, 93-10 to 93-14; Wait Times Report 12 May 2026; Supplementary Budget Estimates 2025–26; Commonwealth Ombudsman investigation into IAT, April 2026.
Join our 2nd CHSP webinar with Ageing Australia

Webinar - Strategic Options: Transition, Partner or Exit
10 June 2026, 12-1 pm (AEST)
Speaker:
Jason Howie
This two-part executive webinar series provides an overview of the challenges and options for CHSP providers preparing to transition to the Support at Home funding program, currently scheduled for no earlier than July 2027.
Webinar 2 – Strategic Options: Transition, Partner or Exit – 10 June 2026
This webinar discusses the nature of the reform and the operational and strategic options available to organisations that are not sure they wish to make the transition, while protecting their staff and clients.
Who should attend?
These webinars are targeted towards board members, executives and operational managers responsible for standalone CHSP providers.
Learn more and register here.
To find out how we can assist your organisation with Support at Home, contact Jason.
Jason Howie
02 9068 0777
jason.howie@prideagedliving.com.au

For support with strategic planning and capital asset management, contact Stephen.
Stephen Rooke
02 9068 0777
stephen.rooke@prideagedliving.com.au